Like CMP3, Bootstrap is field-tested and research-validated, with a focus on deep exploration that supports and engages all kinds of learners. Our integrated computing modules have been proven to support math transfer and can be mixed and matched to supplement what you’re already doing in your classroom. Teaching 6th grade math with Bootstrap also addresses many CS Standards, including: 2-AP-1, 2-AP-10, 2-AP-11, 2-AP-13, 2-AP-14, 2-AP-17 2-AP-19, 2-AP-21, and 2-DA-08.
| CMP3 Unit |
Integrated Computing Lessons that can extend the CMP3 Unit |
Prime Time:
Factors & Multiples
|
-
Instead of a list of rules to memorize, we use the Circles of Evaluation to expose the structure of the math involved in evaluating expressions. Check it out! It’s a powerful tool.
-
Circles of Evaluation can be used without any programming!
|
Covering & Surrounding:
2-Dimensional Measurement
|
-
Get your students coding with highly motivational image functions! Writing simple code to build a wide range of shapes of different colors and sizes, reinforces vocabulary for describing polygons.
-
While this lesson does not focus on area and perimeter, for those looking to extend beyond the scope of the CMP3 unit, the function composition lesson offers an intuitive low-threshold, high-ceiling introduction to transformations.
Surface Area of a Rectangular Prism
-
This lesson engages students in analyzing a rectangular prism to identify which dimensions are needed to find the area of each face.
-
Simple code generates a printable set of rectangles labeled with dimensions. Students use printouts to construct paper models of their prisms and calculate the surface area.
-
Ultimately, students can use their model to generate a formula for calculating the surface area of a prism.
|
Data About Us:
Statistics and Data Analysis
|
-
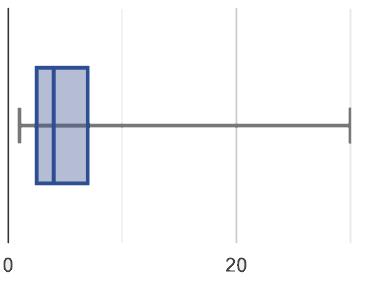
Simple code returns the mean, median, and mode(s) for any real world dataset, allowing for meaningful conversations about why we have to think carefully about which measure of center best represents a given dataset.
|
These materials were developed partly through support of the National Science Foundation,
(awards 1042210, 1535276, 1648684, and 1738598).  Bootstrap by the Bootstrap Community is licensed under a Creative Commons 4.0 Unported License. This license does not grant permission to run training or professional development. Offering training or professional development with materials substantially derived from Bootstrap must be approved in writing by a Bootstrap Director. Permissions beyond the scope of this license, such as to run training, may be available by contacting contact@BootstrapWorld.org.
 Bootstrap by the Bootstrap Community is licensed under a Creative Commons 4.0 Unported License. This license does not grant permission to run training or professional development. Offering training or professional development with materials substantially derived from Bootstrap must be approved in writing by a Bootstrap Director. Permissions beyond the scope of this license, such as to run training, may be available by contacting contact@BootstrapWorld.org.


