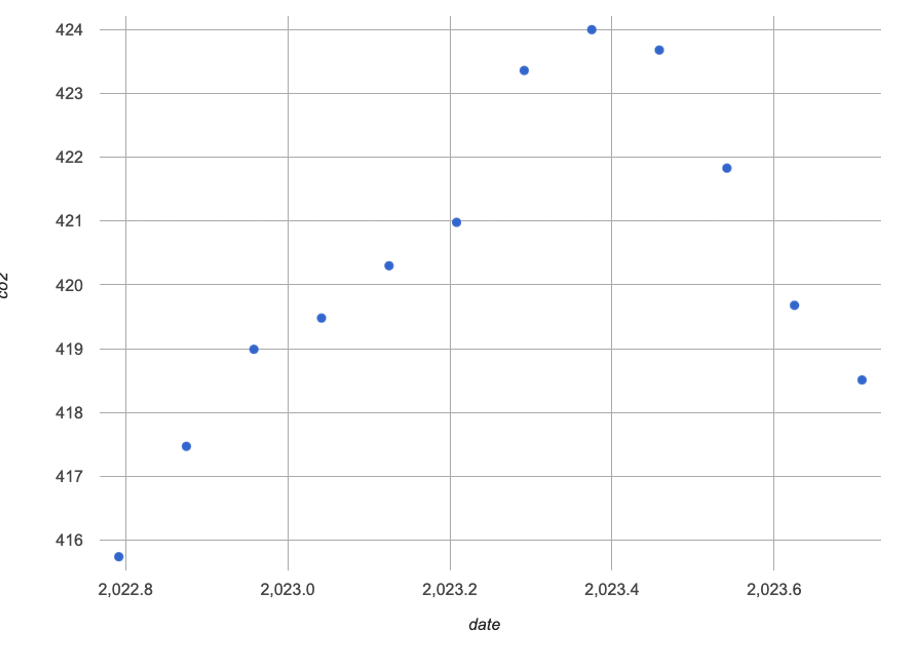
The data below was generated from the Carbon Dioxide Starter File, showing the amount of CO2 in the atmosphere (parts per million) on specific dates from December 2022 to November 2023. NOTE: the date column is the decimal year (so "June 15th, 2023" would be 2023.5).
|
|
1 Connect the dots on the scatter plot to form a line-graph.
2 The distance between the lowest trough and highest peak is parts per million, so the amplitude (a) is parts per million
3 Draw the midline on your graph. (HINT:look at amplitude and trough!). What is the vertical shift (c) of the model? parts per million
4 Estimate the phase shift by estimating the decimal year when the data first crosses the midline (d): years
5 Calculate the period between the troughs by subtracting the dates for the lowest values in 2022 and 2023: years
6 If $$\displaystyle \text{period} = {2\pi \over\displaystyle \text{frequency}}$$, what is the frequency?
7 Using your computed values for a, b, h, and k, define your periodic function below in both Function and Pyret notation.
Function Notation |
periodic(x) = amplitude × sin( frequency (x - horizontal shift) ) + vertical shift |
|
fun periodic(x): ( * sin( * (x - ))) + end |
8 Define this model in Pyret, and fit it to the recent data. What S-value do you get?
9 What does this model actually mean? Fill in the blanks below, and read the completed model aloud with your partner.
Between the end of 2022 and 2023, the amount of CO2 in the air fluctuated between lowest and highest parts-per-million. This pattern appears to be periodic, with an amplitude of amplitude rising and falling around a midline of midline. With 1 year representing a full cycle, we expect this pattern to repeat each year for a frequency of frequency.
These materials were developed partly through support of the National Science Foundation, (awards 1042210, 1535276, 1648684, 1738598, 2031479, and 1501927).  Bootstrap by the Bootstrap Community is licensed under a Creative Commons 4.0 Unported License. This license does not grant permission to run training or professional development. Offering training or professional development with materials substantially derived from Bootstrap must be approved in writing by a Bootstrap Director. Permissions beyond the scope of this license, such as to run training, may be available by contacting contact@BootstrapWorld.org.
